WORKSPACE MANAGEMENT
KD Workplace is the essential suite for any work environment: optimising the use of meeting rooms and workstations while making the employee’s work flow more smoothly.
To date, KD Workplace has improved the daily lives of tens of thousands of people in their workspaces.
This suite consists of 4 elements:
- Presence detection and counting sensors, selected by our iOT R&D teams
- A scenario engine, connected to the reservation diaries and sensors, applying rules for creating, deleting and modifying meetings
- Devices for displaying occupancy information on tablets, screens, smartphones and luminaires
- An occupancy dashboard, developed alongside Workplace consultants and based on years of tailor-made reporting requests from our customers
The sensors
Selecting sensors to generate actions in real time, such as changing the colour code of the luminaire according to the reservation status of a meeting, is a highly demanding task. It’s not just about statistics, it’s about producing a result that is immediately visible to everyone. The sensors will need to be more or less responsive depending on the context (workstation, phonebox, meeting room) and the choice of signal transport will also have an impact, often dictated by cyber security rules, the presence of protocols already in place or the spatial granularity of the information required. The complexity lies in striking a balance between dimensions that call on a variety of skills: constraints of space, IT rules, user experience and the desired level of reporting.
The scenario engine
This second part of the KD Workplace solution is the most impressive leverage you can offer your employees to improve their day-to-day experience. Companies and their teams have suffered from unreliable information ever since meeting rooms became bookable: staff book a space but don’t honour their meeting, rooms are occupied despite no bookings being made, meetings are stretched – or shortened – over time and this information is not visible via the booking system. For most companies, the proportion of time when the information is unreliable exceeds 70%, according to our deletion/creation/modification statistics, and the subject now extends to unallocated bookable workstations. Our scenario engine is capable of resolving 90% of these situations by adapting the booking information available in the diaries to the reality of what is happening, without any intervention from users.
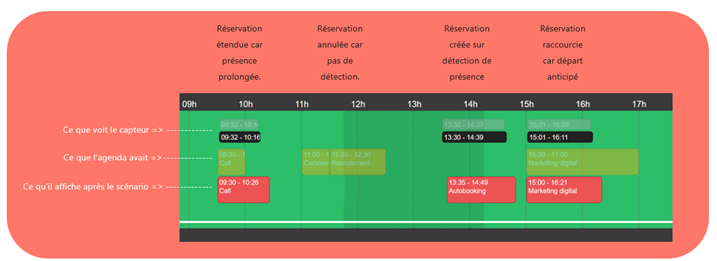
The scenario engine is a tool based on a principle of continuous improvement, in line with changes in usage identified on the market, and is central to acting on a unique number of situations:
- Create a reservation if occupancy is detected and, conversely, cancel a slot if no one is present after X minutes
- Extend an existing reservation if participants are still present, and conversely shorten it if it has been cut short.
- Smooth out the sensor information, both when no presence is detected but in terms of usage it is preferable to wait a few minutes before freeing the space, and for situations where it is detected even though it is only a passageway.
- Link occupancy information to the number of people present in the space
- Cancel recurring reservations after X unfulfilled bookings.
All these elements can be contextualised by time of day and by group of spaces (workstation, phonebox, meeting room), while being diagnosed to avoid a sensor emitting dubious data. If this is the case, its actions will be temporarily deactivated to prevent false information being generated on the diaries. All the information is fed into the building’s global data repository, enabling indicators to be displayed via our dashboards, with the aim of understanding user behaviour in terms of reservations and occupancy.
Display devices
Once the raw data from presence and counting sensors has been contextualised and scripted, its primary function can be presented to its target audience: employees. Our teams work daily to set up display systems covering all the needs of commercial buildings:
- Occupancy and booking information displayed on 10″ tablets, combined with digital signage.
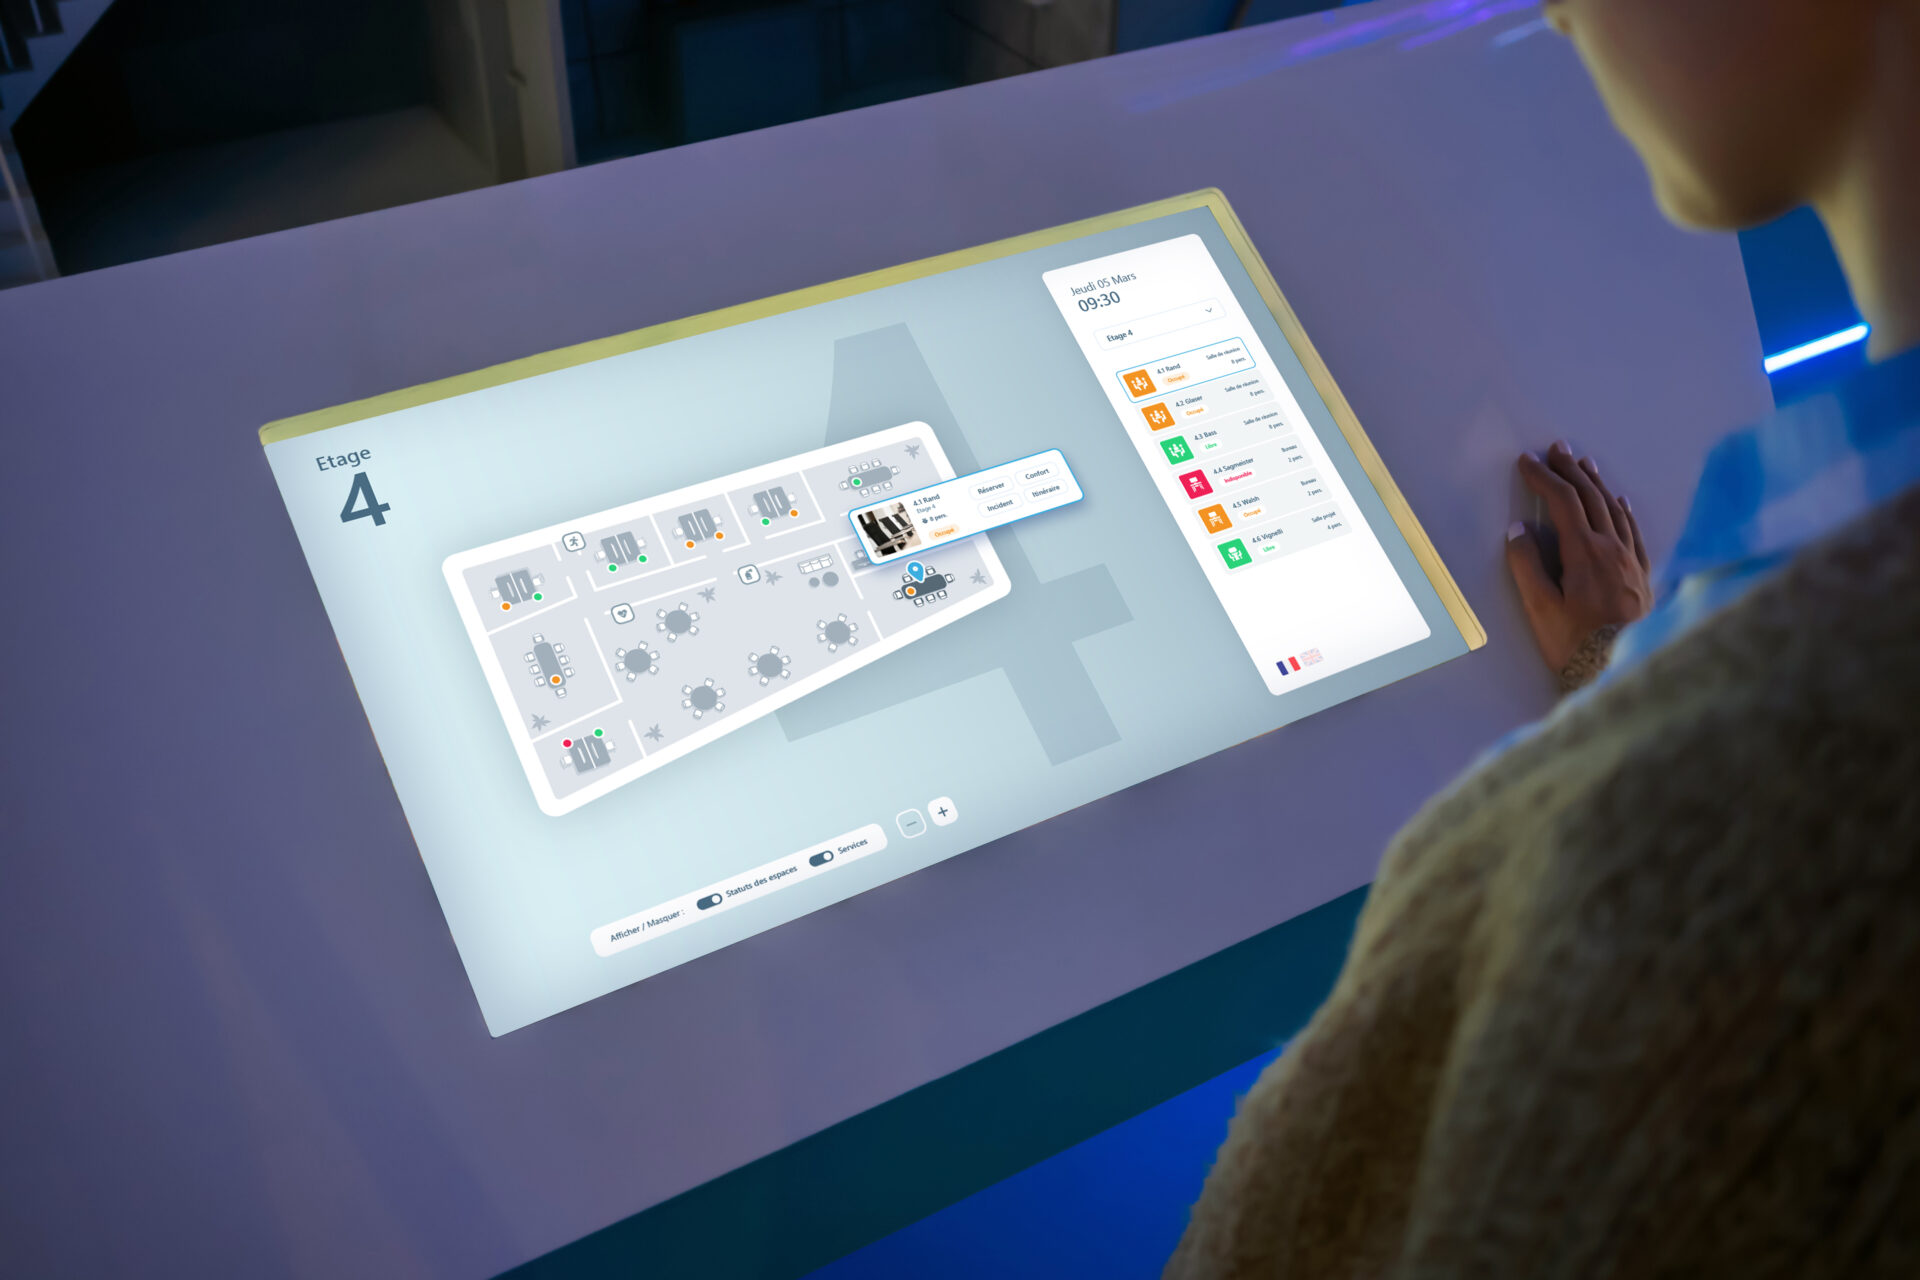
- Interactive 3D floor plans on large screens (we recommend 32″ or 43″), displaying reservations, occupancy and utilisation rates on a space-by-space basis, as well as data such as the weather, road traffic and train timetables.
- Connected luminaires showing reservation and occupancy status via specific colour codes
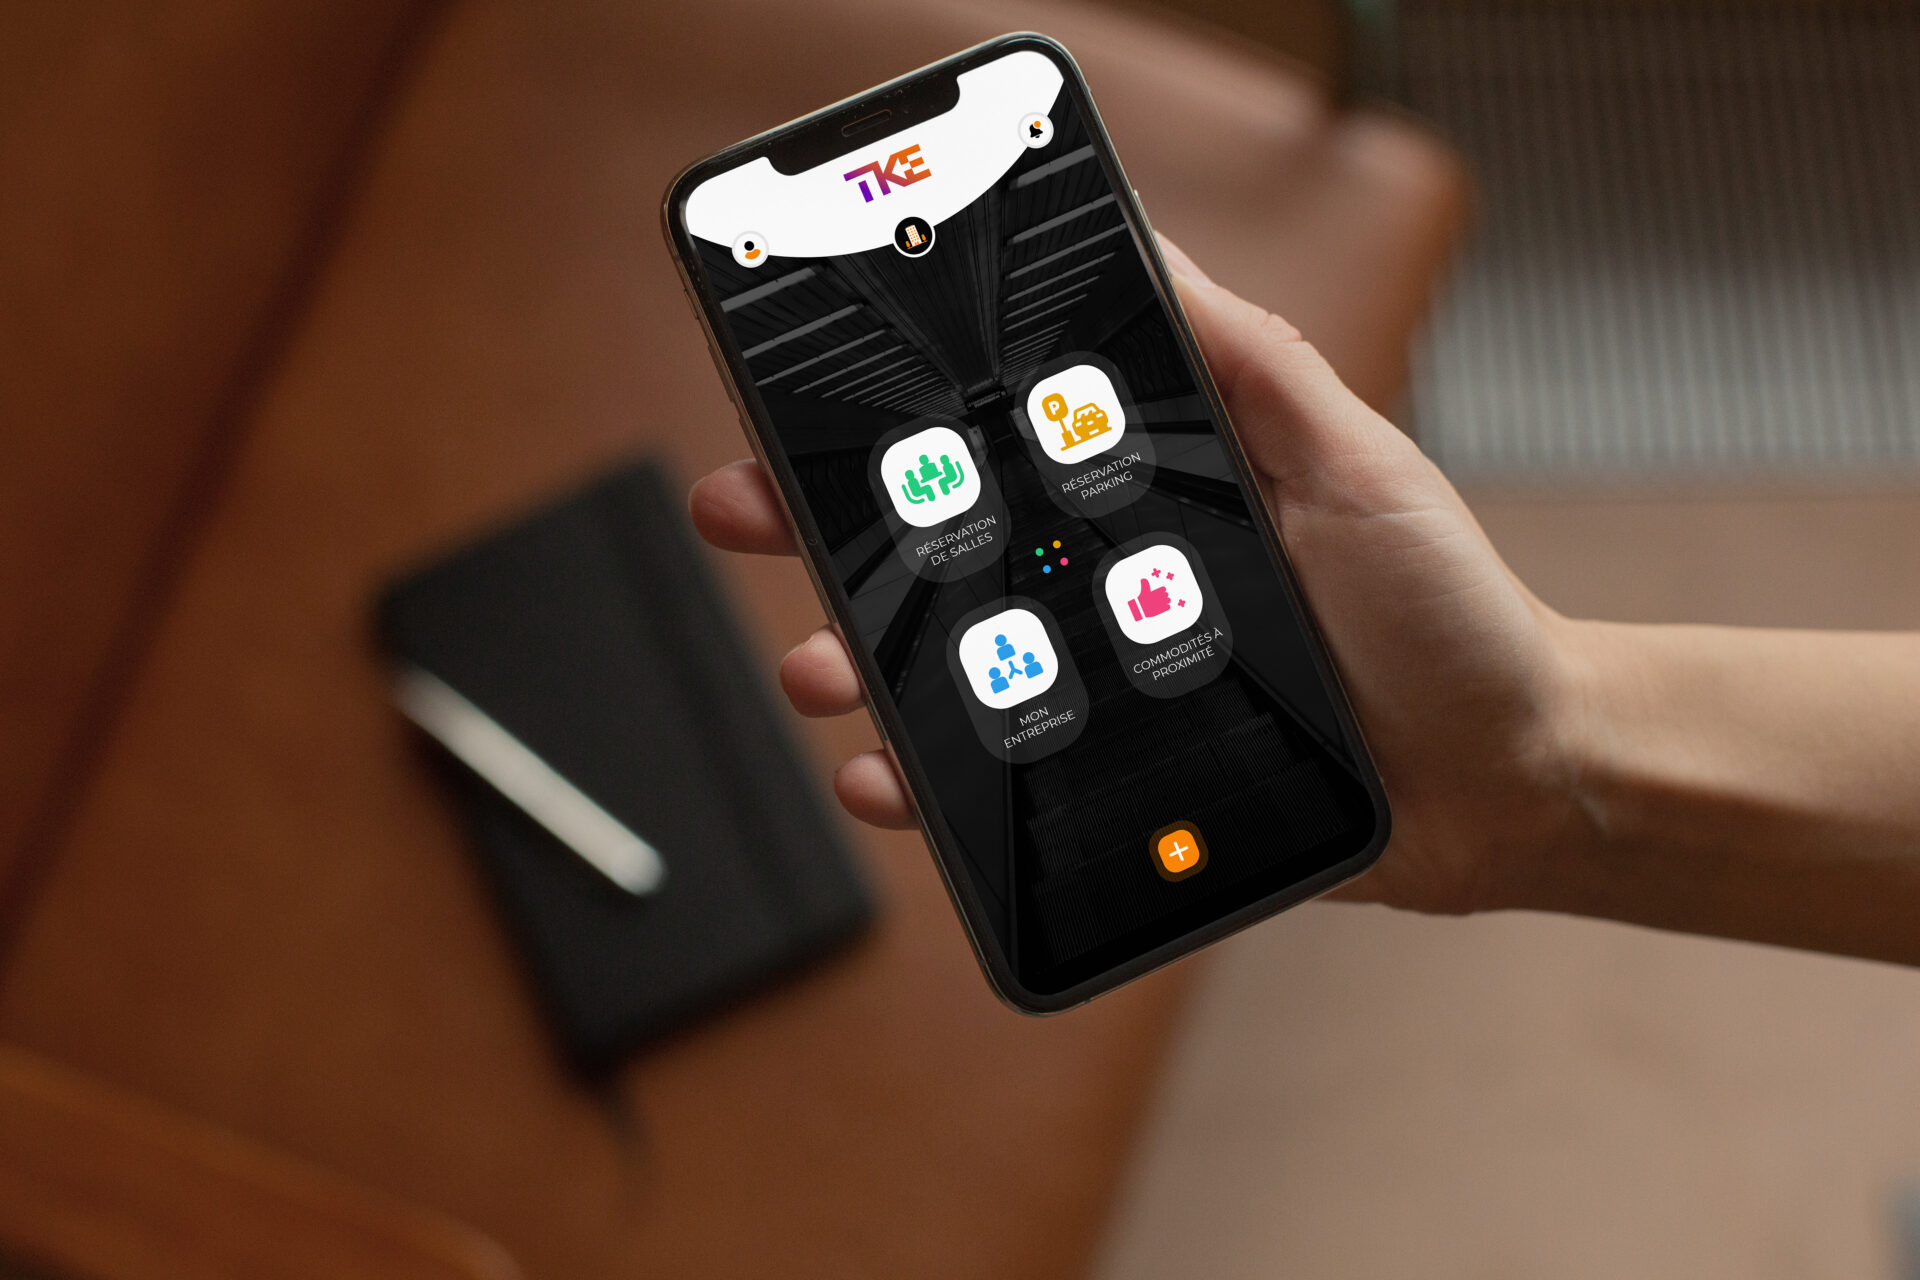
- Interfaces for computers or smartphones that use the same ergonomically-adapted information as the large screens.
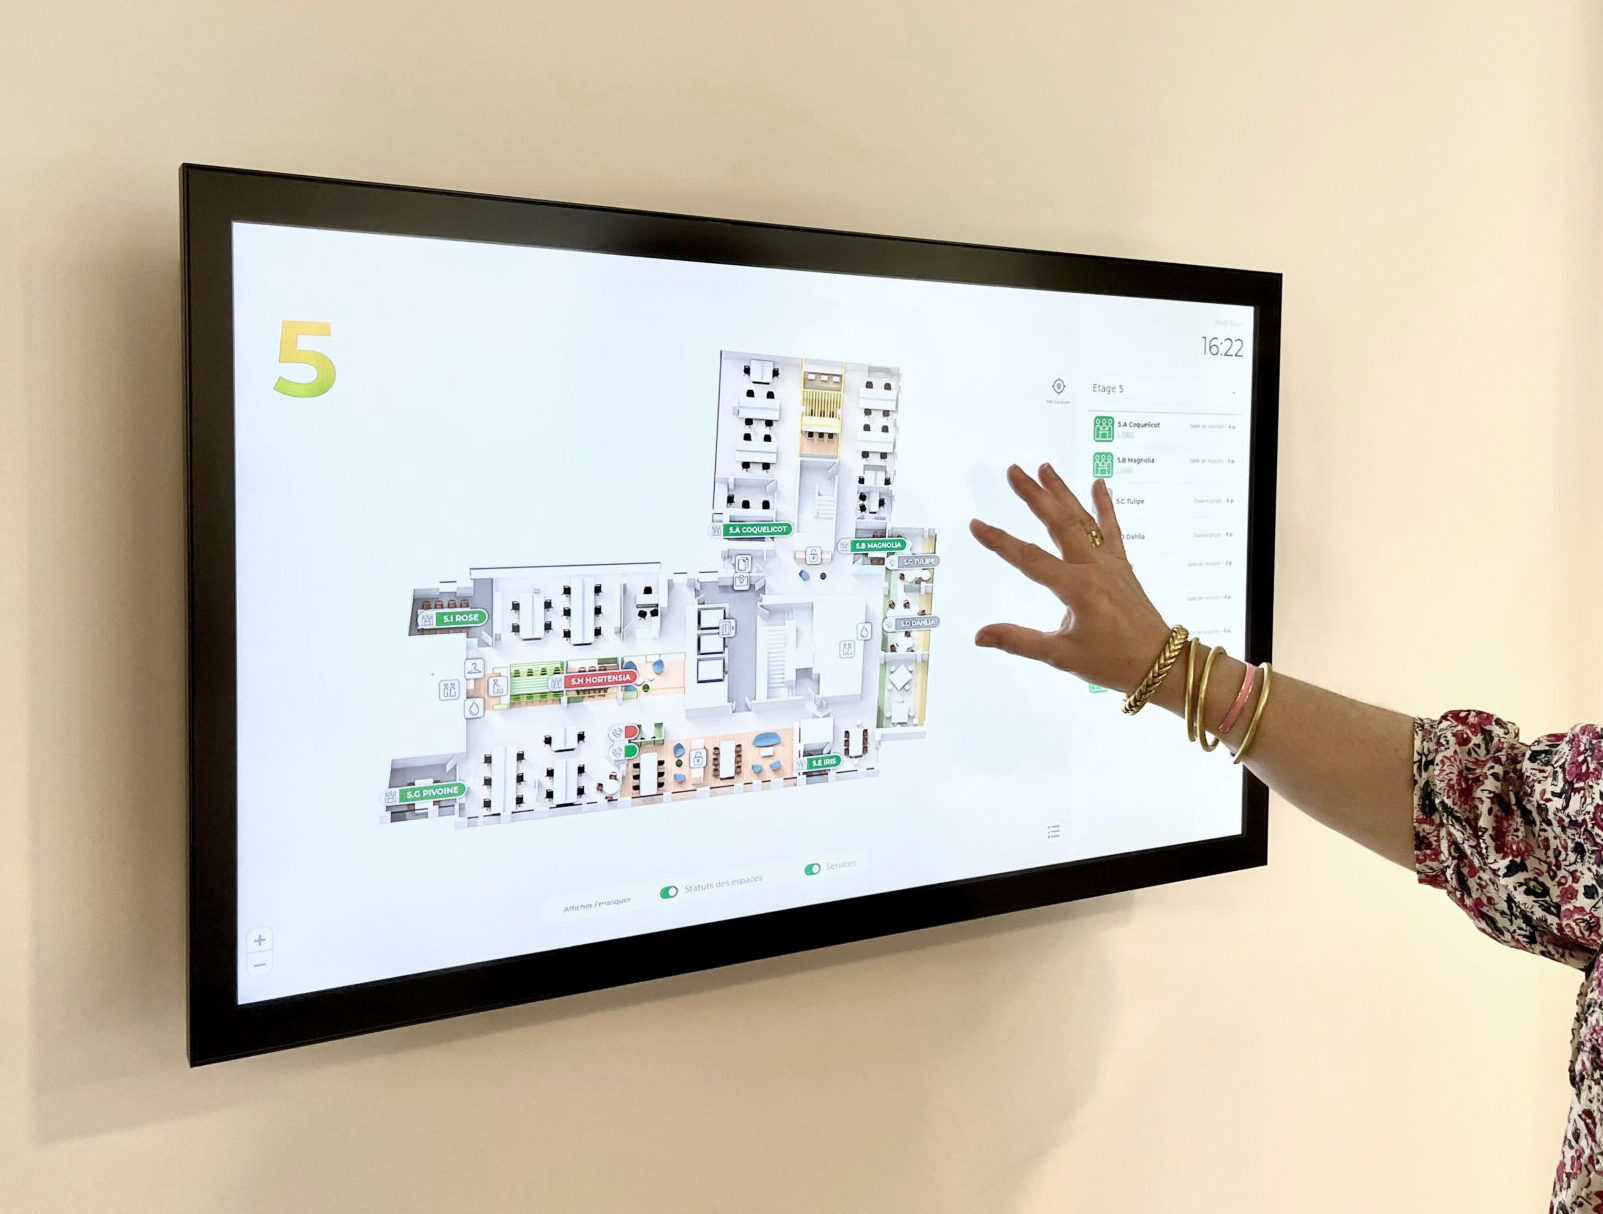
3D maps – KD Map
3D maps, a solution developed by our graphics and development team, offer high-quality rendering while consuming very few terminal resources. These interior architect’s renderings provide details of your layouts and equipment, and are enhanced with information on meeting rooms, workstations and floor occupancy rates. You can navigate between floors, zoom in and out to adapt the level of detail, search for available spaces using filters and reserve them on the fly. The content is displayed using our digital signage solution, KD Signage, which enables the display to be managed remotely and in standby mode.
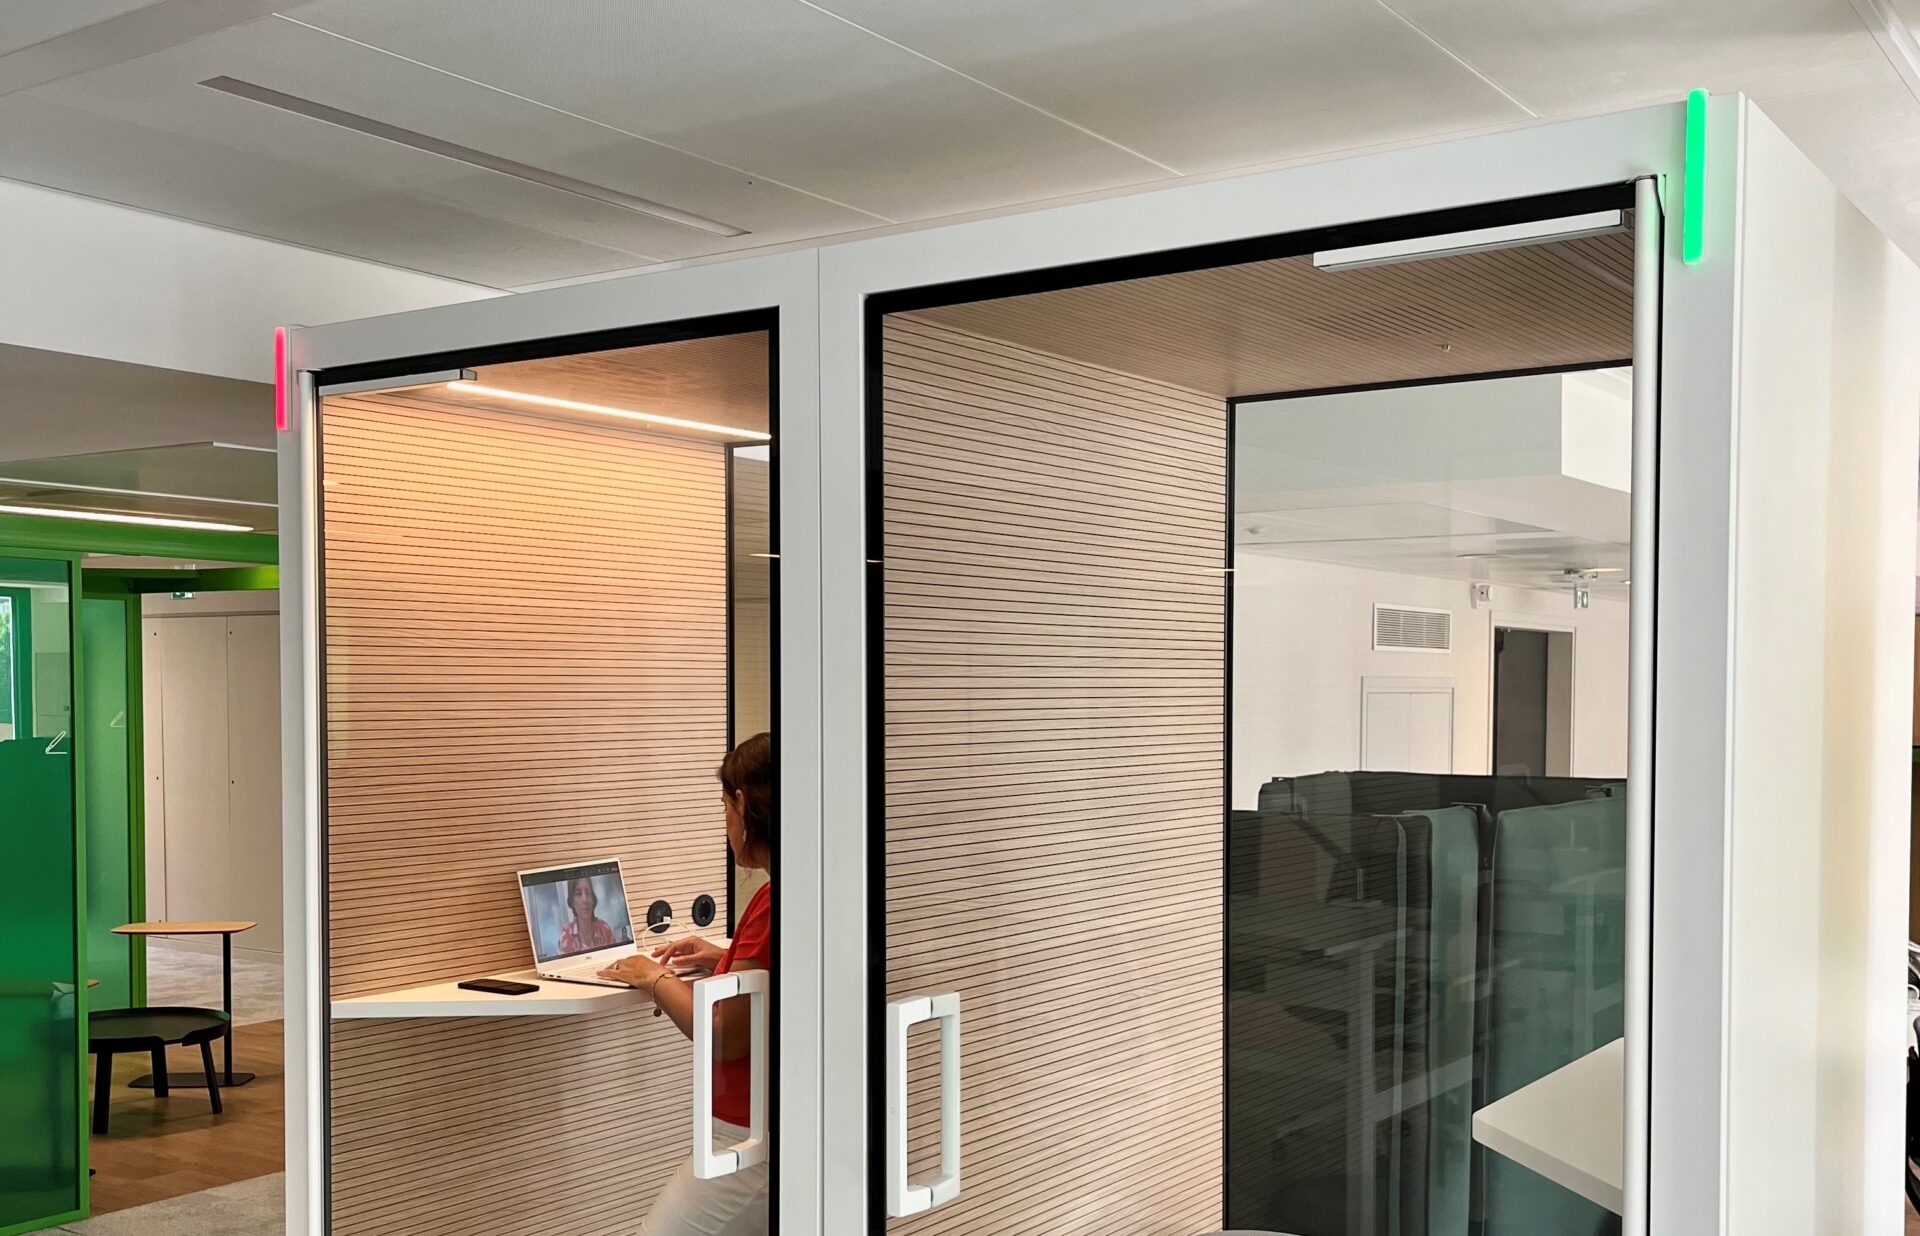
Connected luminaires – KD Light
Connected luminaires are an innovation that responds to the growing need for signage in non-reservable spaces, while offering an alternative solution to the installation of tablets for reasons of cost, consumption and, above all, carbon footprint. With the aim of offering equipment that met the following requirements: a professional product that could be integrated into a corporate network, powered by POE, remote-controlled and customisable, our teams came to the conclusion that no product with these characteristics existed on the market. So we developed KD Light, our connected lighting solution.
.
Its features are as follows:
- A range of models, including one with a 3D-printable cover that can be customised in terms of shape and content
- Electronic part detached from the luminous part to maximise the illuminated area
- MQTTS data transport
- No operating system, maximum security
- Luminaires send vital signals so they can be monitored
- Remote colour setting to change LED behaviour
- Pre-set scenarios, covering all situations via a specific colour code: green for immediate availability, orange for occupancy in the next few minutes, red for real-time unavailability
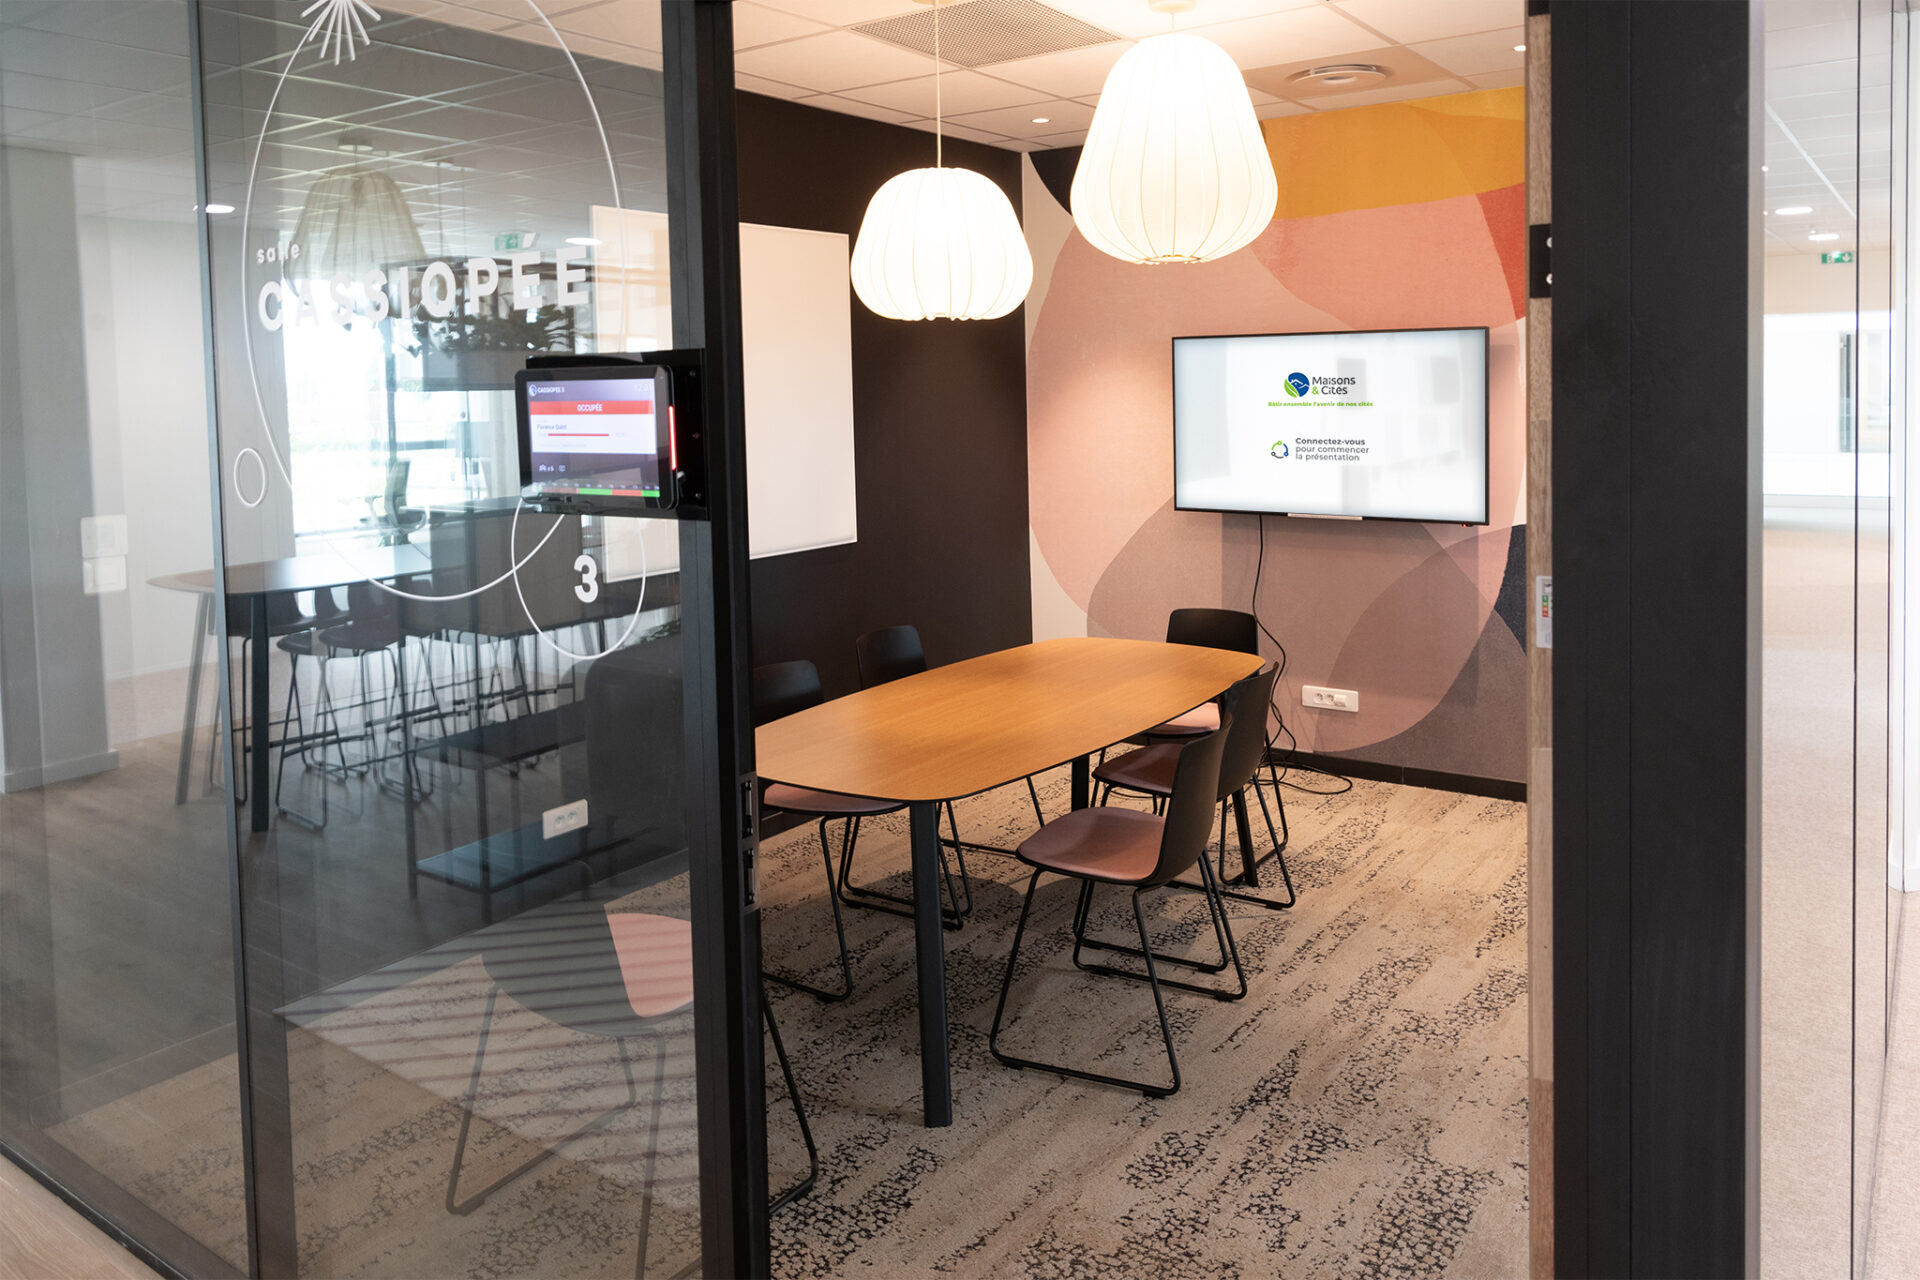
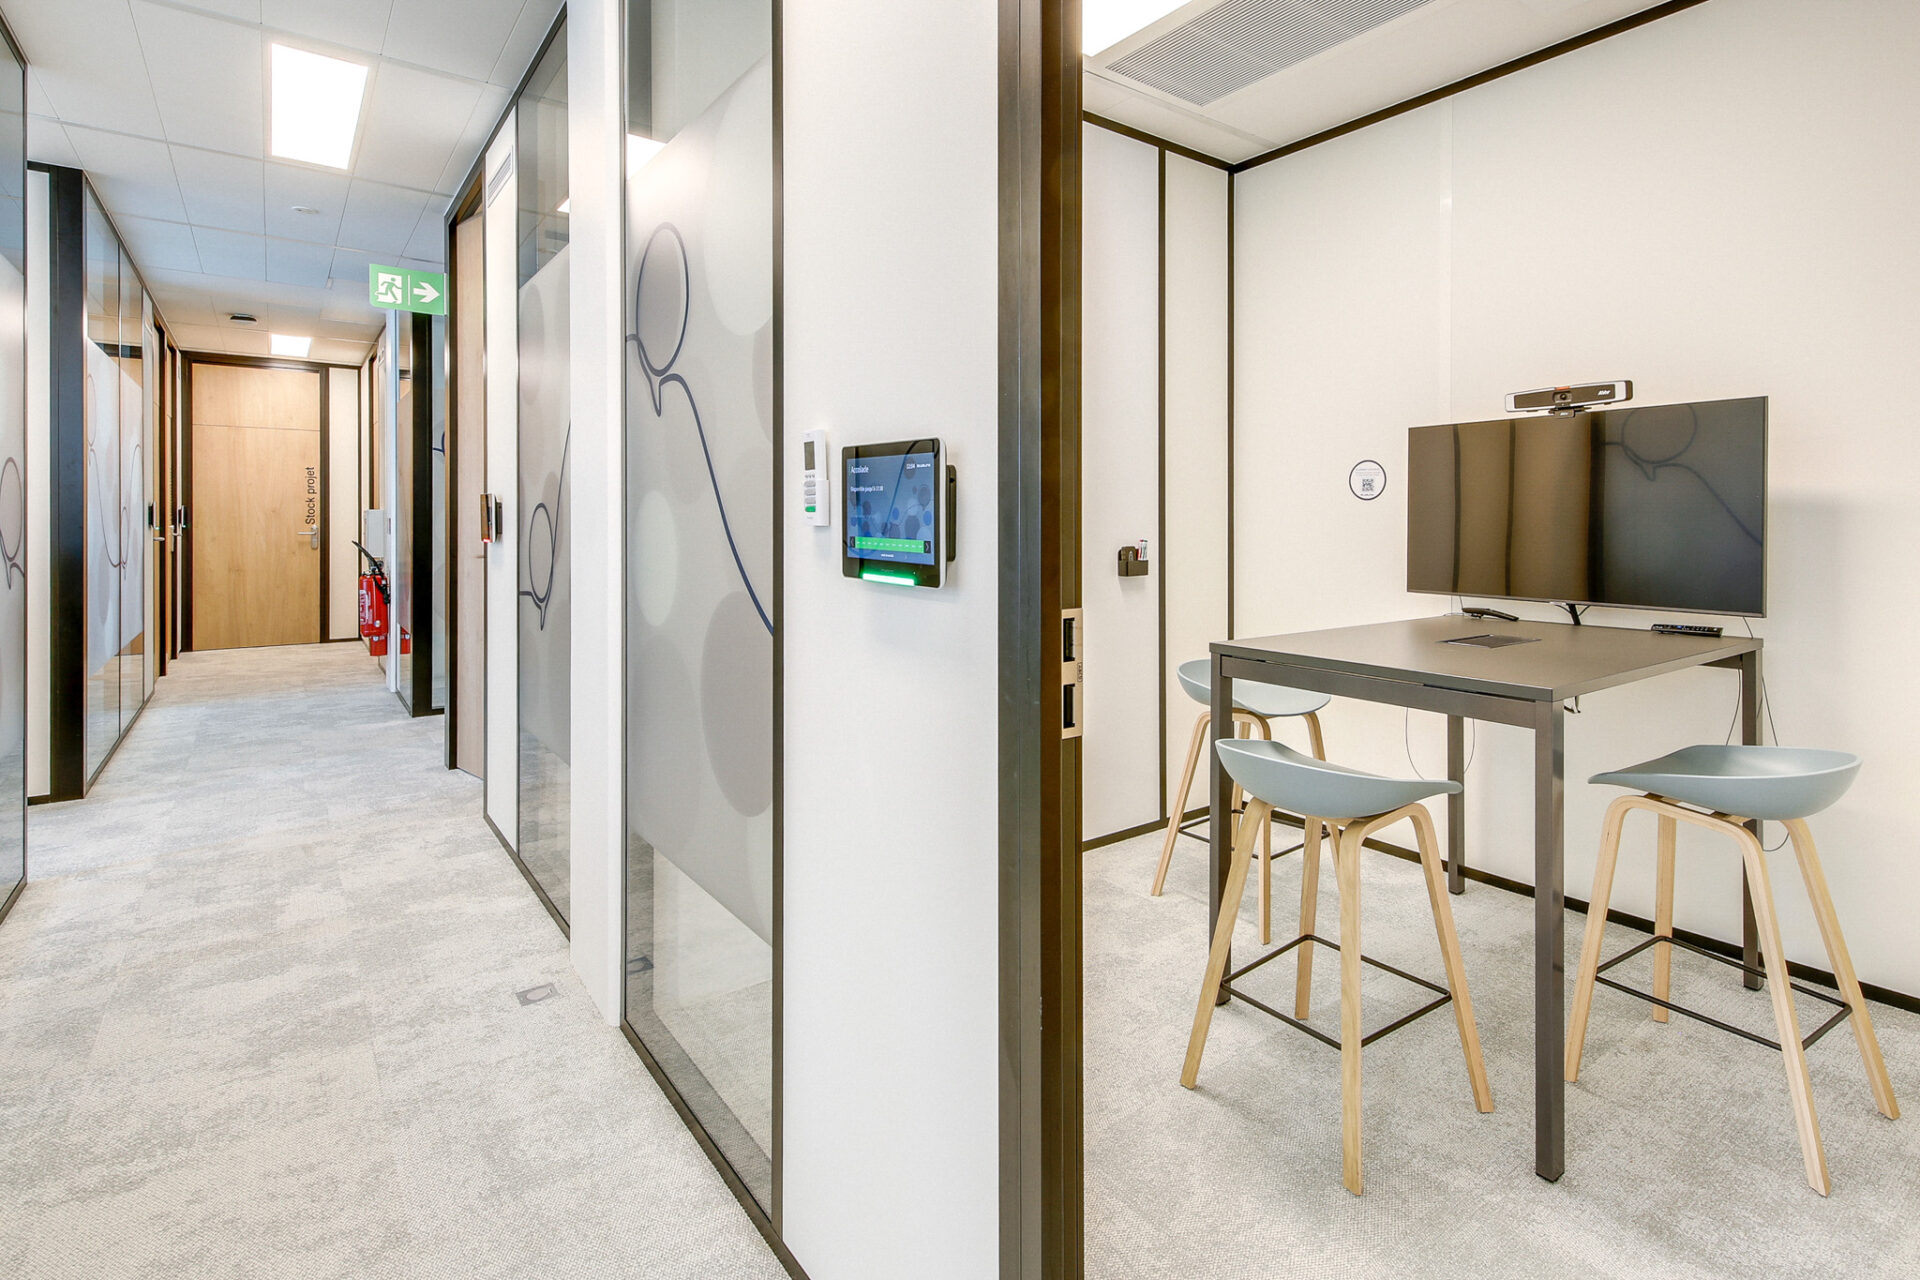
Tablets – KD Display
The tablets display the occupancy status of the room (free, reserved, occupied) in real time using distinctive graphic elements: a timeline and an LED banner. At the same time, for on-the-fly reservations, the touch function can be activated. It is also possible to broadcast digital signage loops when the screen is in standby mode, using our KD Signage digital signage solution.
This solution for tablets is manufacturer agnostic (pure HTML/JS), but we recommend the Philips solution for Android, for which we have added advanced features such as management of network slowness/interruptions and a night mode to reduce energy consumption, all of which can be controlled remotely.
Laptop and smartphone interfaces
All the functions offered in the touchscreen version of KDMap mentioned above are available in the form of a Responsive Web interface optimised for computers and smartphones, as well as through integration with the building services application.
Occupancy dashboards
Since 2022, our teams have been working hard to offer unified dashboards consolidating all the data on the building and its uses via the KD Convergence platform. As a result, we can process data from any source and offer overlay or correlation processing between data.
For occupancy data, our ambition is to recommend the best platform on the market. To achieve this goal, we provide a set of standardised dashboards and customised dashboards tailored to the needs of our customers. The standard reports are the result of years of support from our consulting teams and the hundreds of bespoke reports we have been asked to produce since 2017. By combining this with an international benchmark, we have come up with the most advanced statistical platform on the occupancy of a commercial building to date. Our R&D team is at the heart of the development of the processes and indicators, and in particular our Data Scientists, who are trained to process our customers’ data during bespoke consultancy assignments.
The dashboards have been designed to display the data and graphical renderings that provide an at-a-glance understanding of the phenomenon being observed. We wanted to focus on the meaning that decision-makers can derive from the graphs and tables to support their decision-making, while at the same time being educational and transparent about the data and calculations made.
These occupancy dashboards can also be implemented with data from the building itself, such as vehicle flows in car parks and air quality data. So it’s possible to cross-reference space occupancy data with an infinite number of KPIs to create the dashboard of your dreams.
DISCOVER OUR REFERENCES & NEWS IN WORKSPACE MANAGEMENT